Diagram Types
This page collects the current diagram families, their status, and links to available examples.
See the node and edge reference for a compact list of content available to each diagram type.
IA (Information Architecture) / Place Map
Source of truth for product structure: what exists, where it lives, and how it connects.
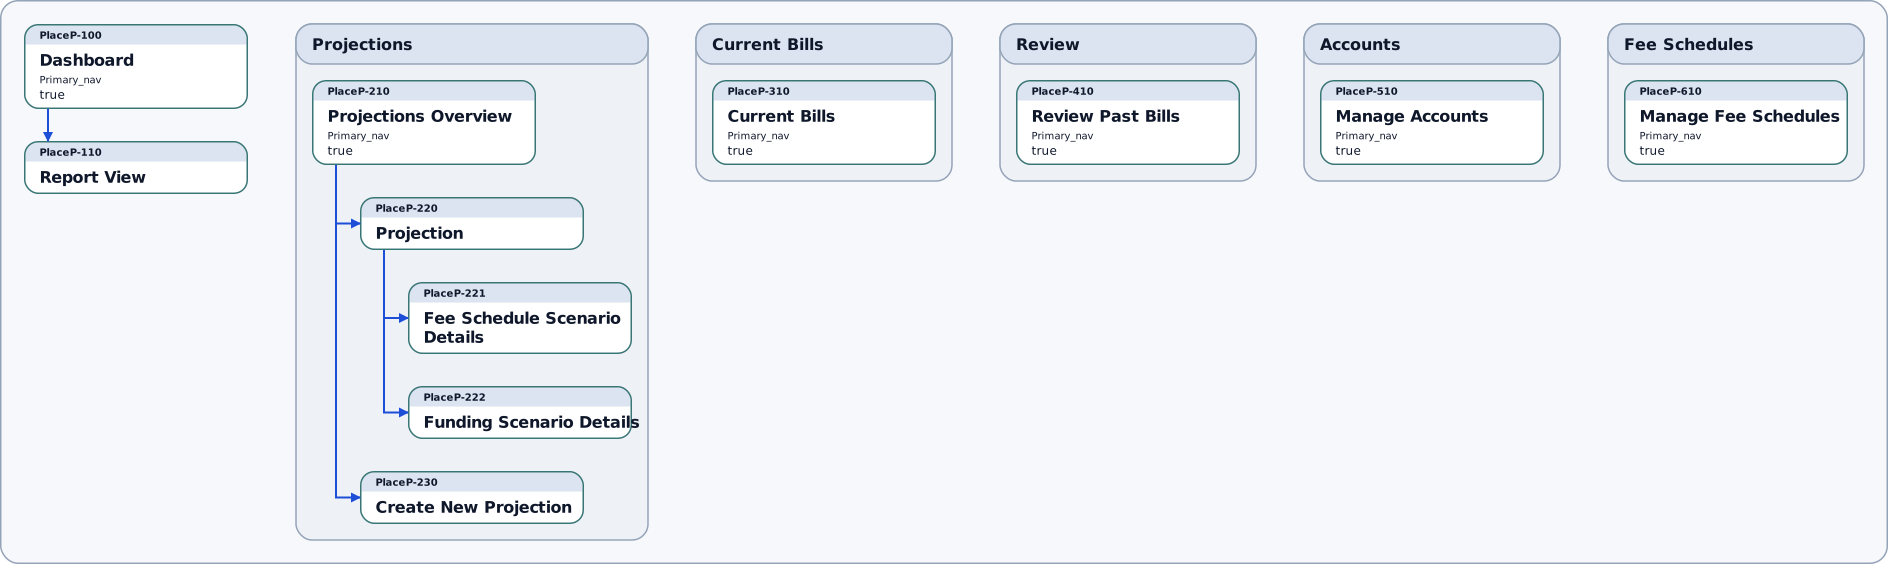
This view shows Areas and Place nested with CONTAINS, with NAVIGATES_TO connections between Places.
Examples:
outcome_to_ia_trace_example Detail: Compact
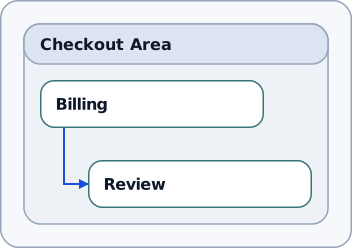
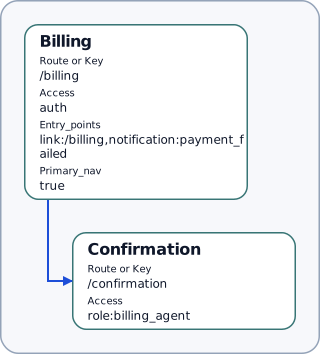
place_viewstate_transition_example Detail: Detailed
billSage app Detail: CompactDecorators: Type, ID
UI Contracts
Component hierarchy, UI composition and state changes, with local Place and Component scopes.
Examples:
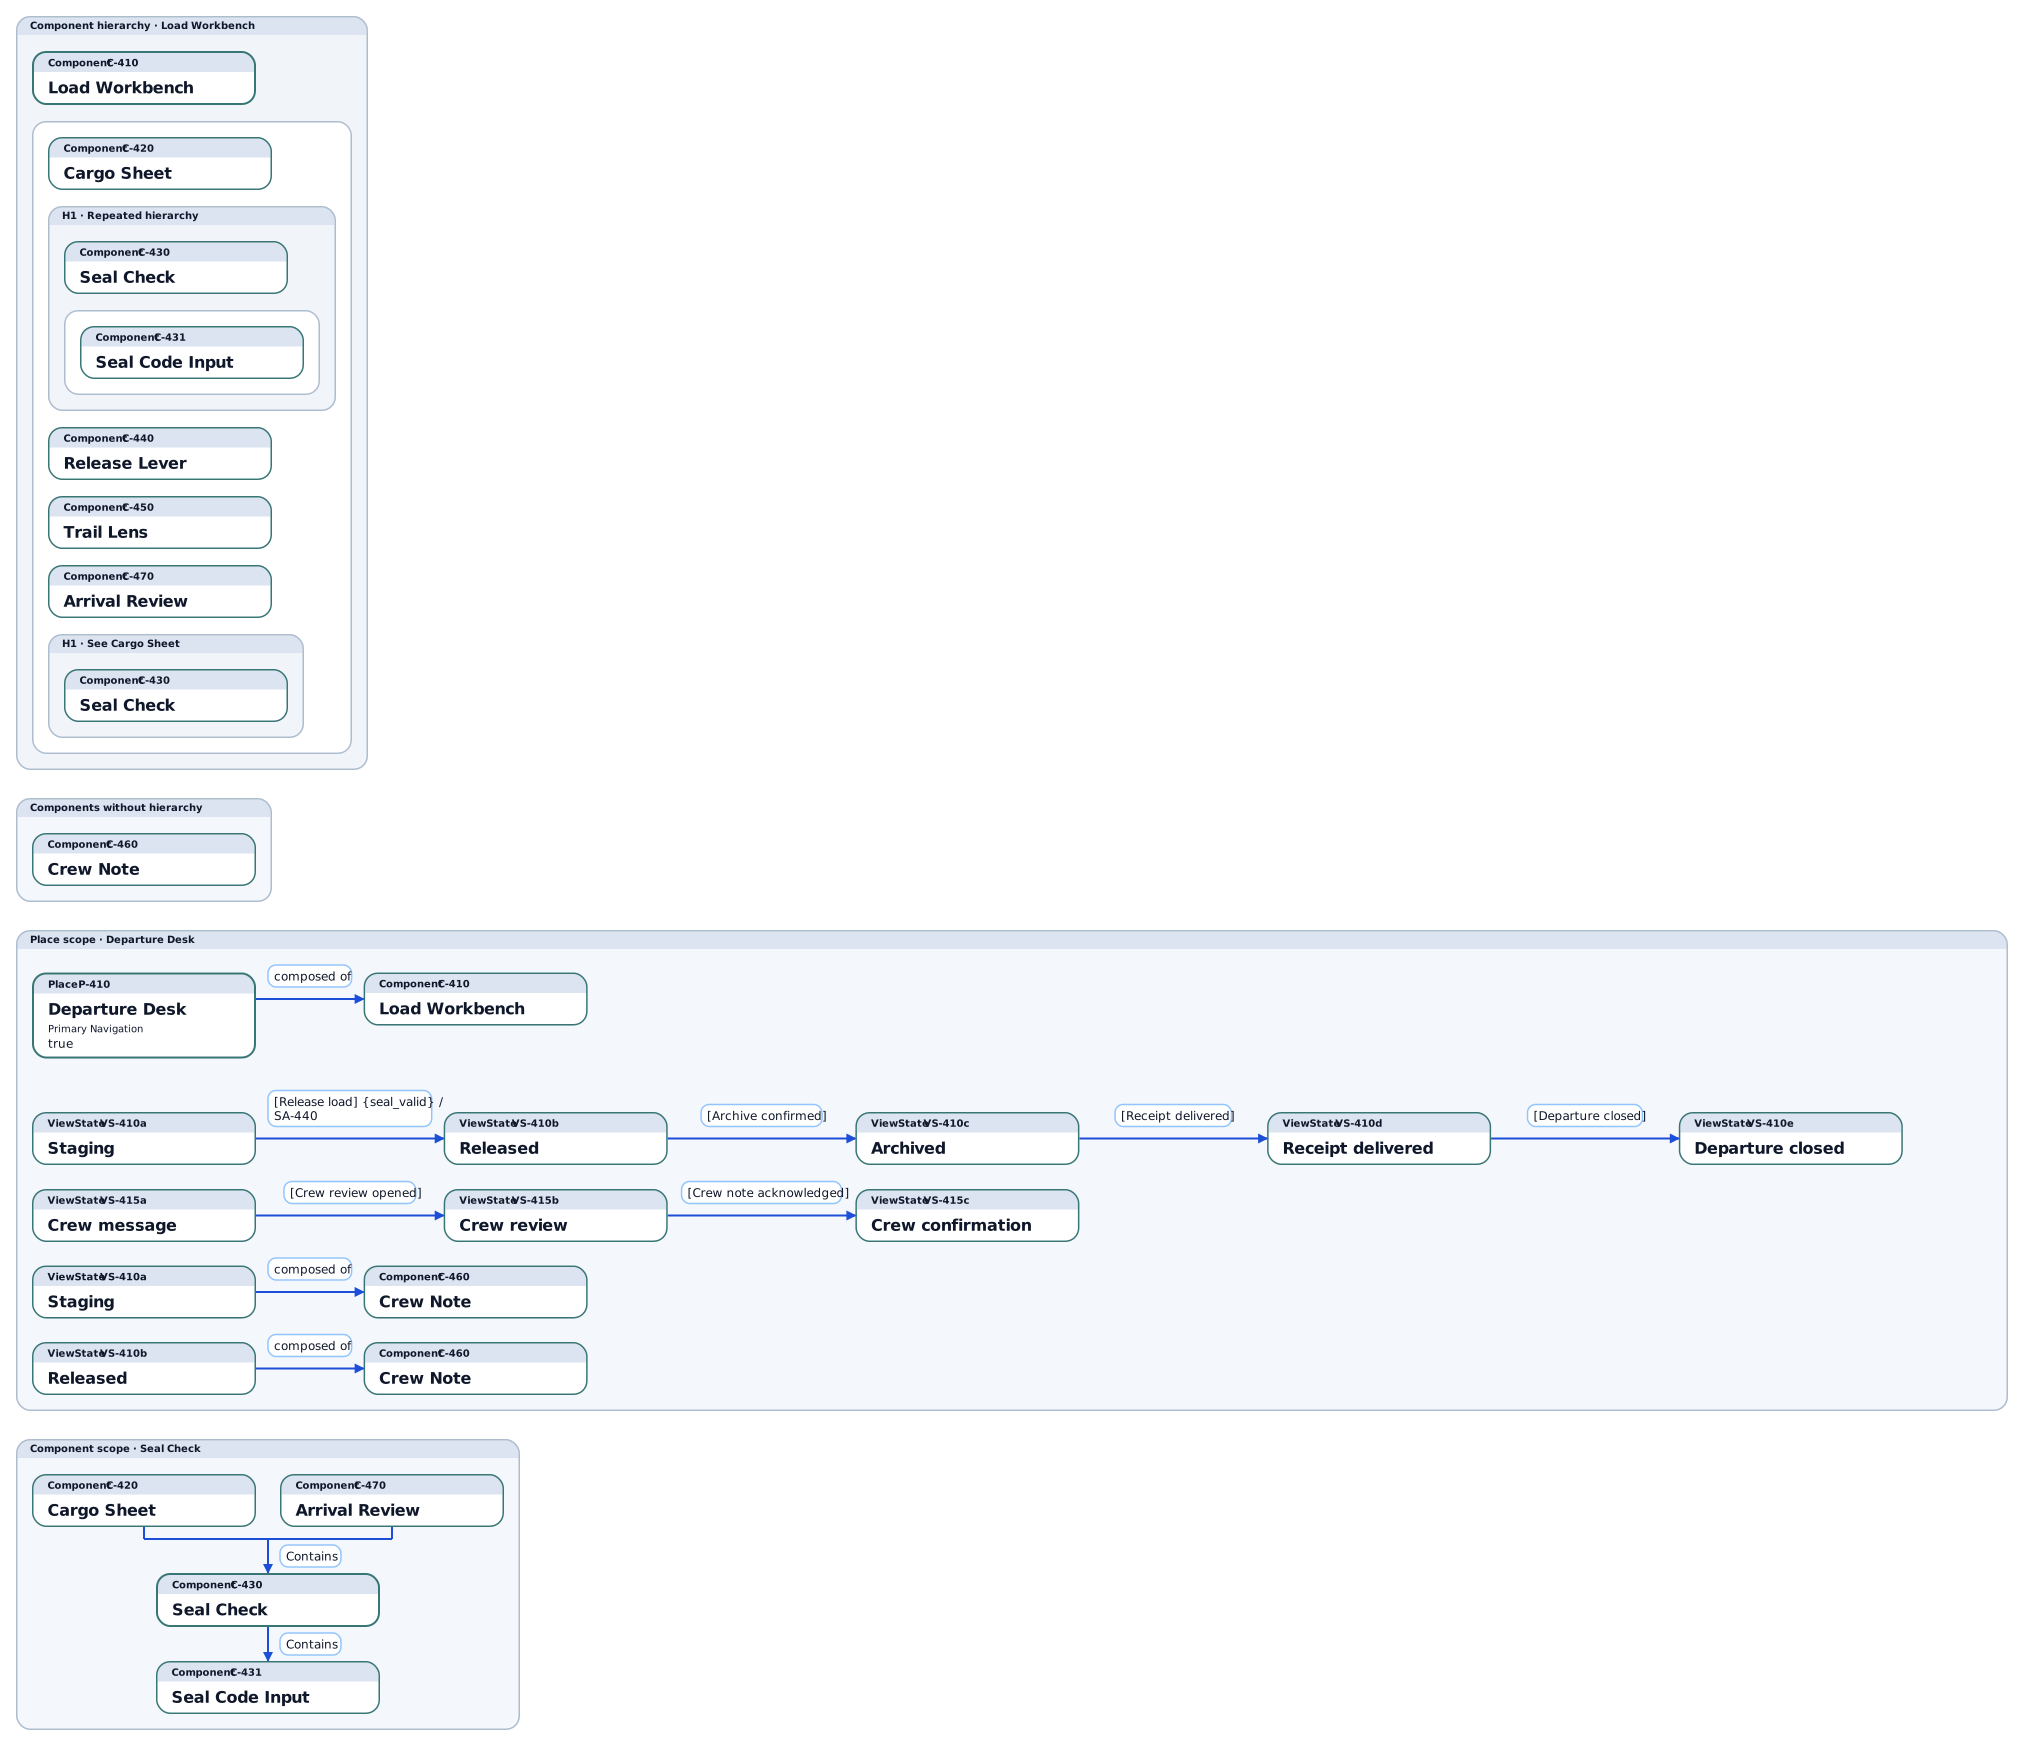
departure_desk_example Detail: CompactDecorators: Type, ID
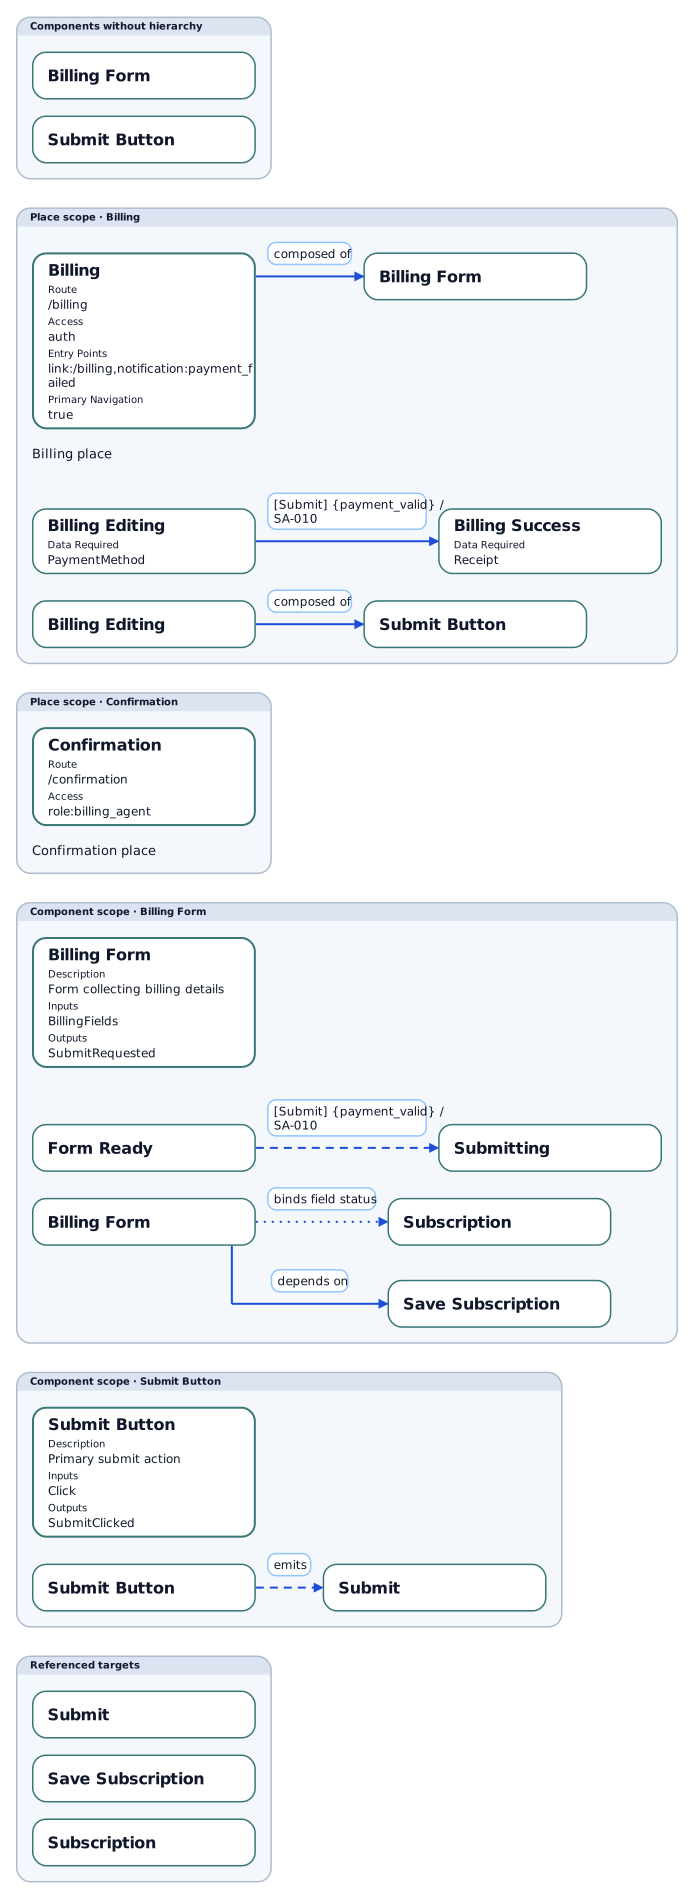
place_viewstate_transition_example Detail: Detailed
ui_state_fallback_example Detail: Detailed
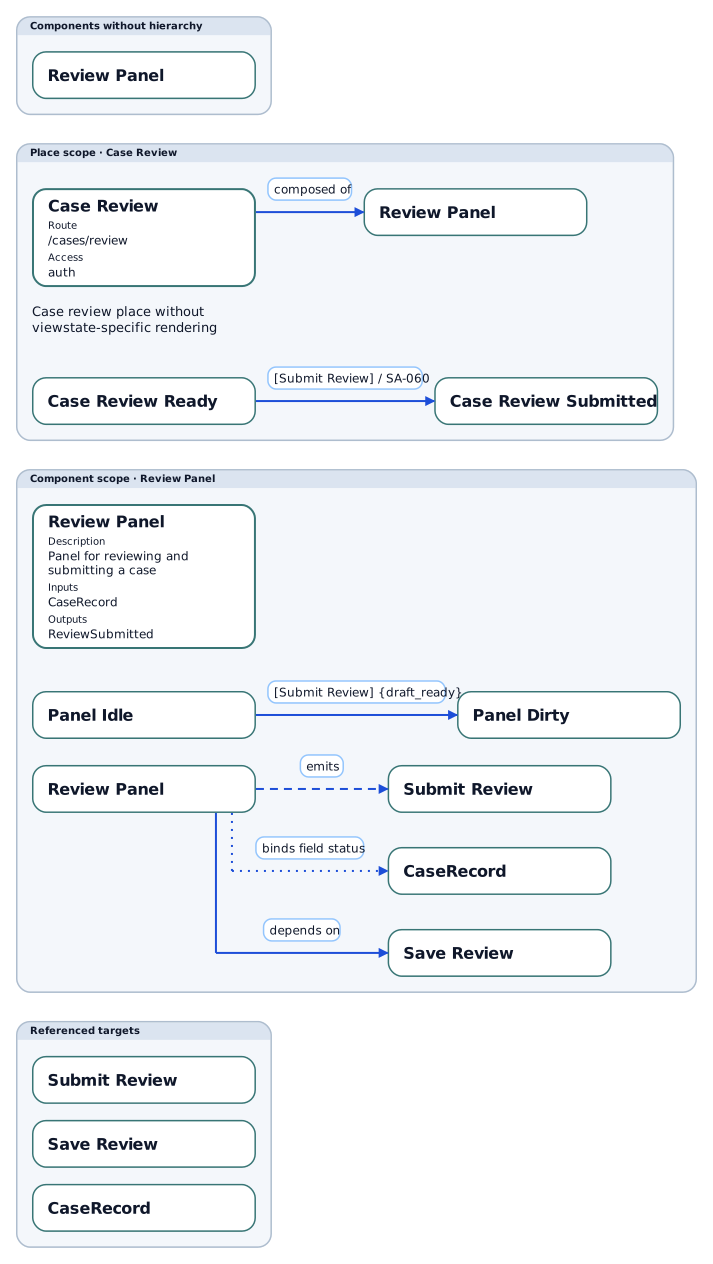
The overview shows Component containment with nested enclosures. Each Component also has a local scope containing all immediate parents and children.
Place and Component scopes show horizontal state sequences, composition references, and outgoing contracts from one source reference.
See UI Contracts Guide for a closer look.
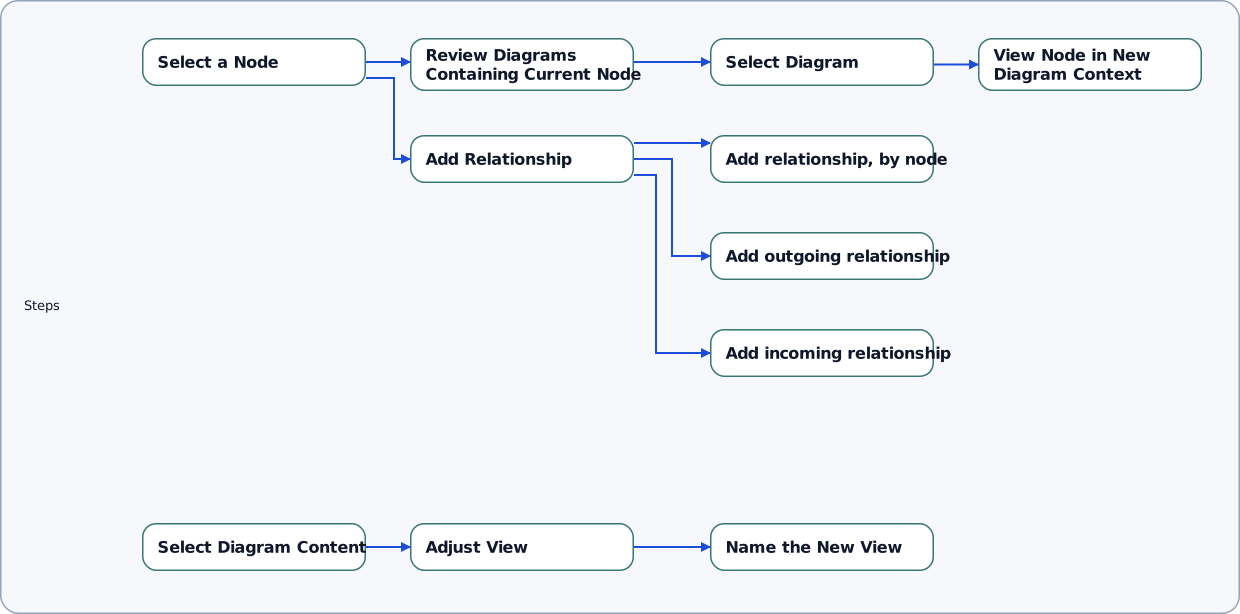
Scenario Flow
Step-by-step UI-level activities (but without collapsing the world into screens).
The x-axis shows horizontal progressions ("bands"). The y-axis shows non-empty lanes for Steps, Places and View States, with persistent rows for branch alternatives and separated row groups for independent flows.
Example:
scenario_branching_example Detail: Compact
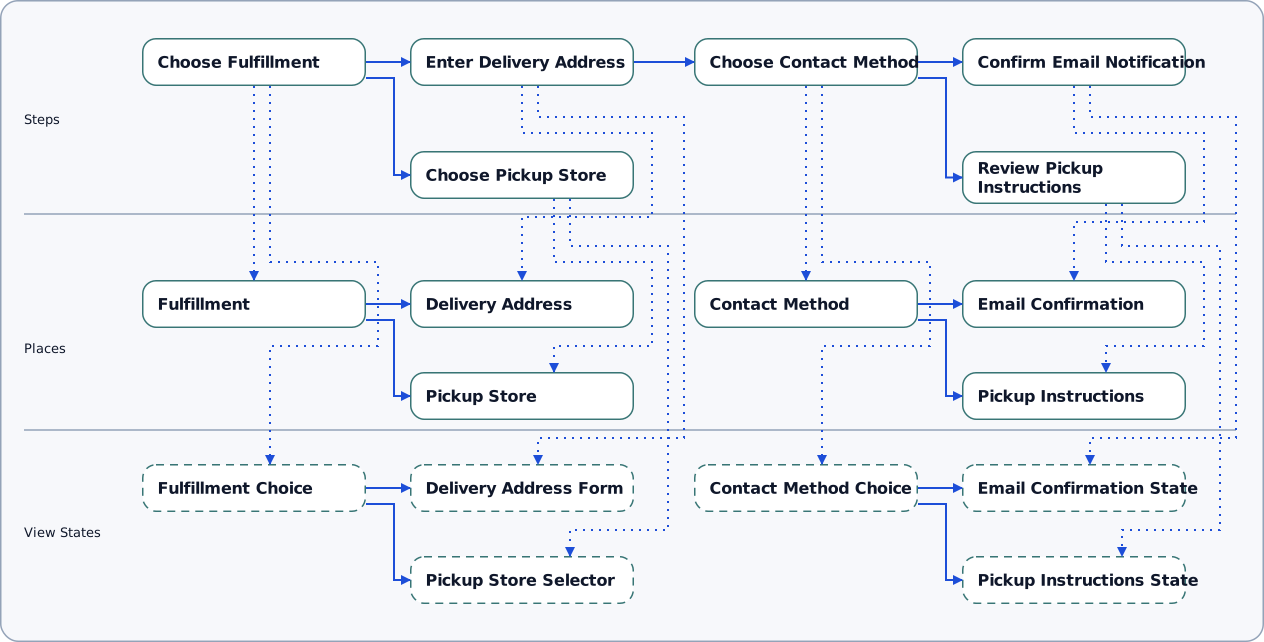
flow_journey_topology_challenge_example Advanced topology
Journey Map
User / customer journey, expressing the high-level sequence of interactions with the product. (Steps also appear in the more technical service blueprint, see above.)
Stages contain source-ordered Steps, while PRECEDES relationships define journey flow.
Examples:
three_branch_journey_example Three-way branch
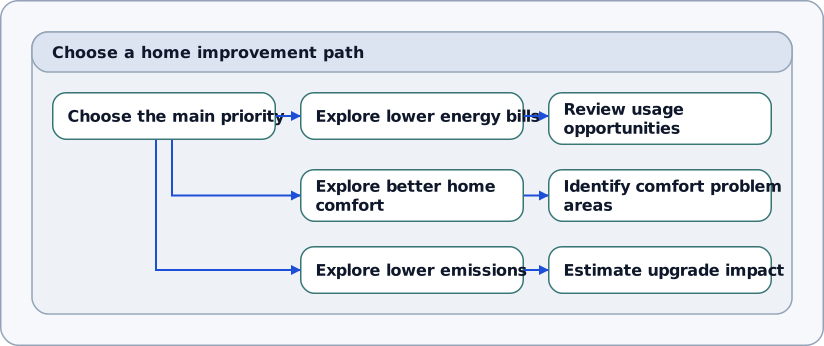
branching_journey_example Detail: Compact

outcome_to_ia_trace_example Detail: Compact
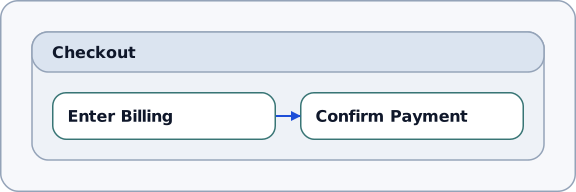
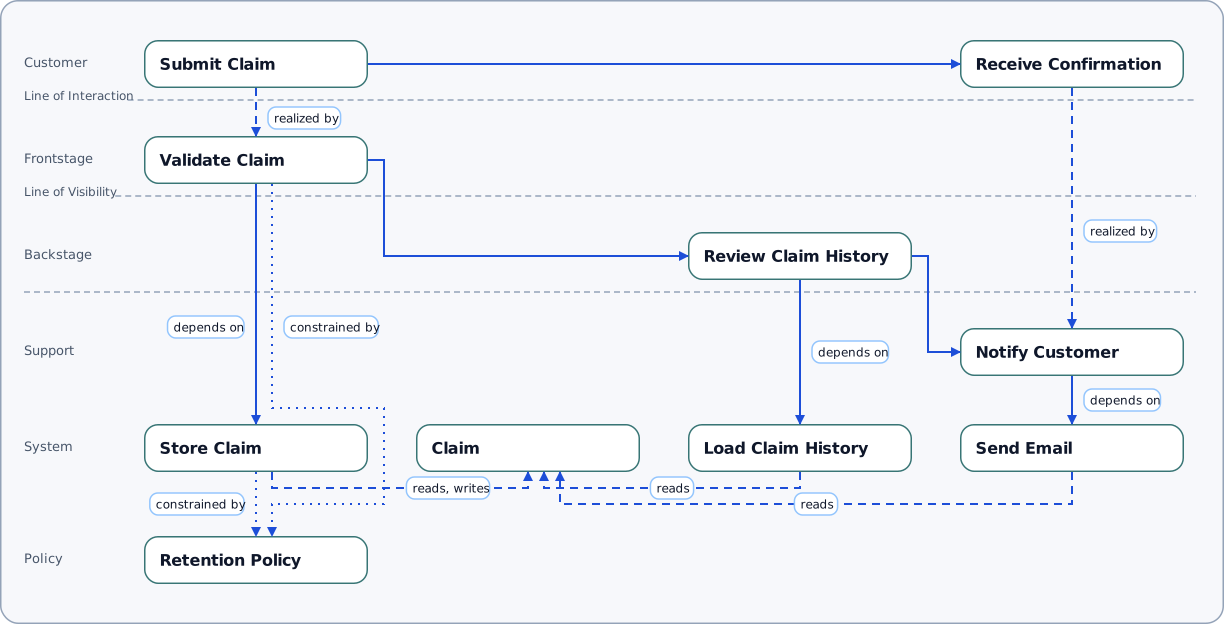
service_blueprint_slice_example Detail: Compact

Outcome-Opportunity Map
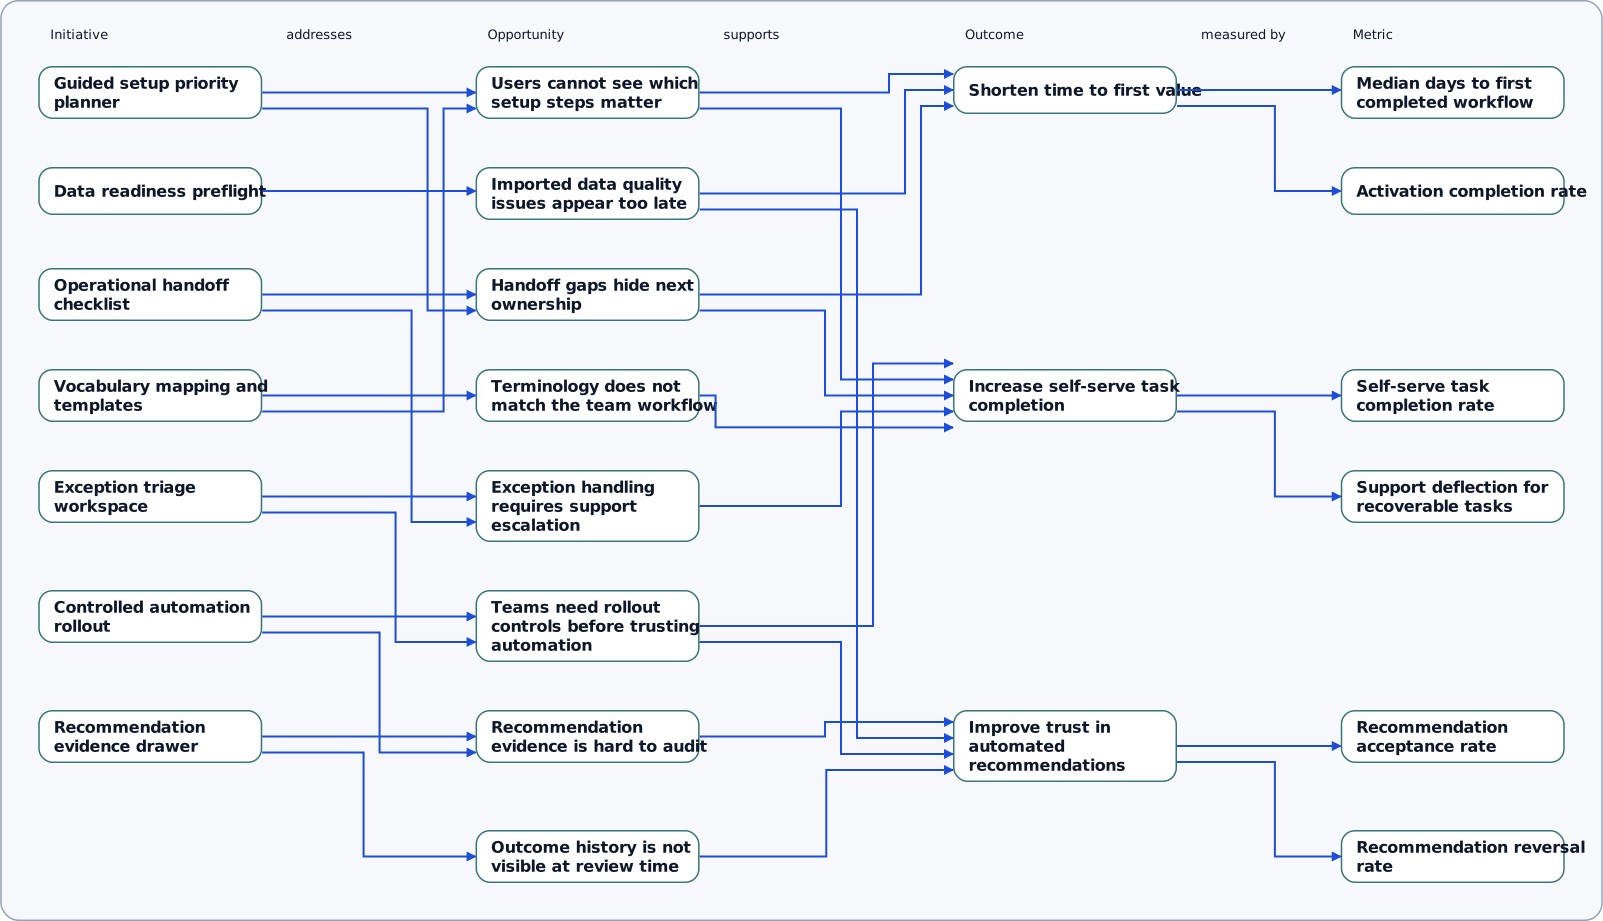
Product intent, explicit and traceable: what the product solves, and how to know it works.
The x-axis shows columns for Initiatives, Opportunities, Outcomes, Metrics. The y-axis displays a band for each Outcome, stacking rows when a column contains multiple entries.
Examples:
outcome_to_ia_trace_example Detail: Detailed

metric_event_instrumentation_example Detail: Compact

multiple_outcomes Detail: Compact
Service Blueprint
Connects user experience steps to the layers needed to realize it.
The x-axis shows customer journey progression over time: Anchor bands (columns) for steps connect a customer step the frontstage and backstage operations that make the step happen. Steps are ordered by PRECEDES. Additional interstitial bands are shown for work that advances between customer steps. The y-axis shows fixed service lanes: customer, frontstage, backstage, support, system, and policy.
Note: a single column is sometimes called a slice, but a slice can also be broader, covering an entire feature.
Example:
Service Blueprint Slice example Detail: Detailed